There's a wide variety of services available now for extracting complex PDFs, especially those with tables, into Markdown format.
In this article, we're showing a comparison between the latest API-based services, and what's available in our Graphlit Platform.
For all third-party API services, we used their freely available demo APIs or online demos.
In some cases, the APIs only returned HTML not Markdown. For those APIs, we converted the HTML to Markdown using ChatGPT.
For the rendered Markdown images, we pasted the Markdown text into the Markdown Live Preview application and took a screenshot.
TL;DR:
Graphlit using LLM Mode - with Anthropic Sonnet 3.5 - provides the most accurate results for PDF to Markdown extraction.
Sample Table
This is the sample table we are using for comparison (converted to PDF format for the testing).

LlamaParse
Accurate Mode
Rendered Markdown
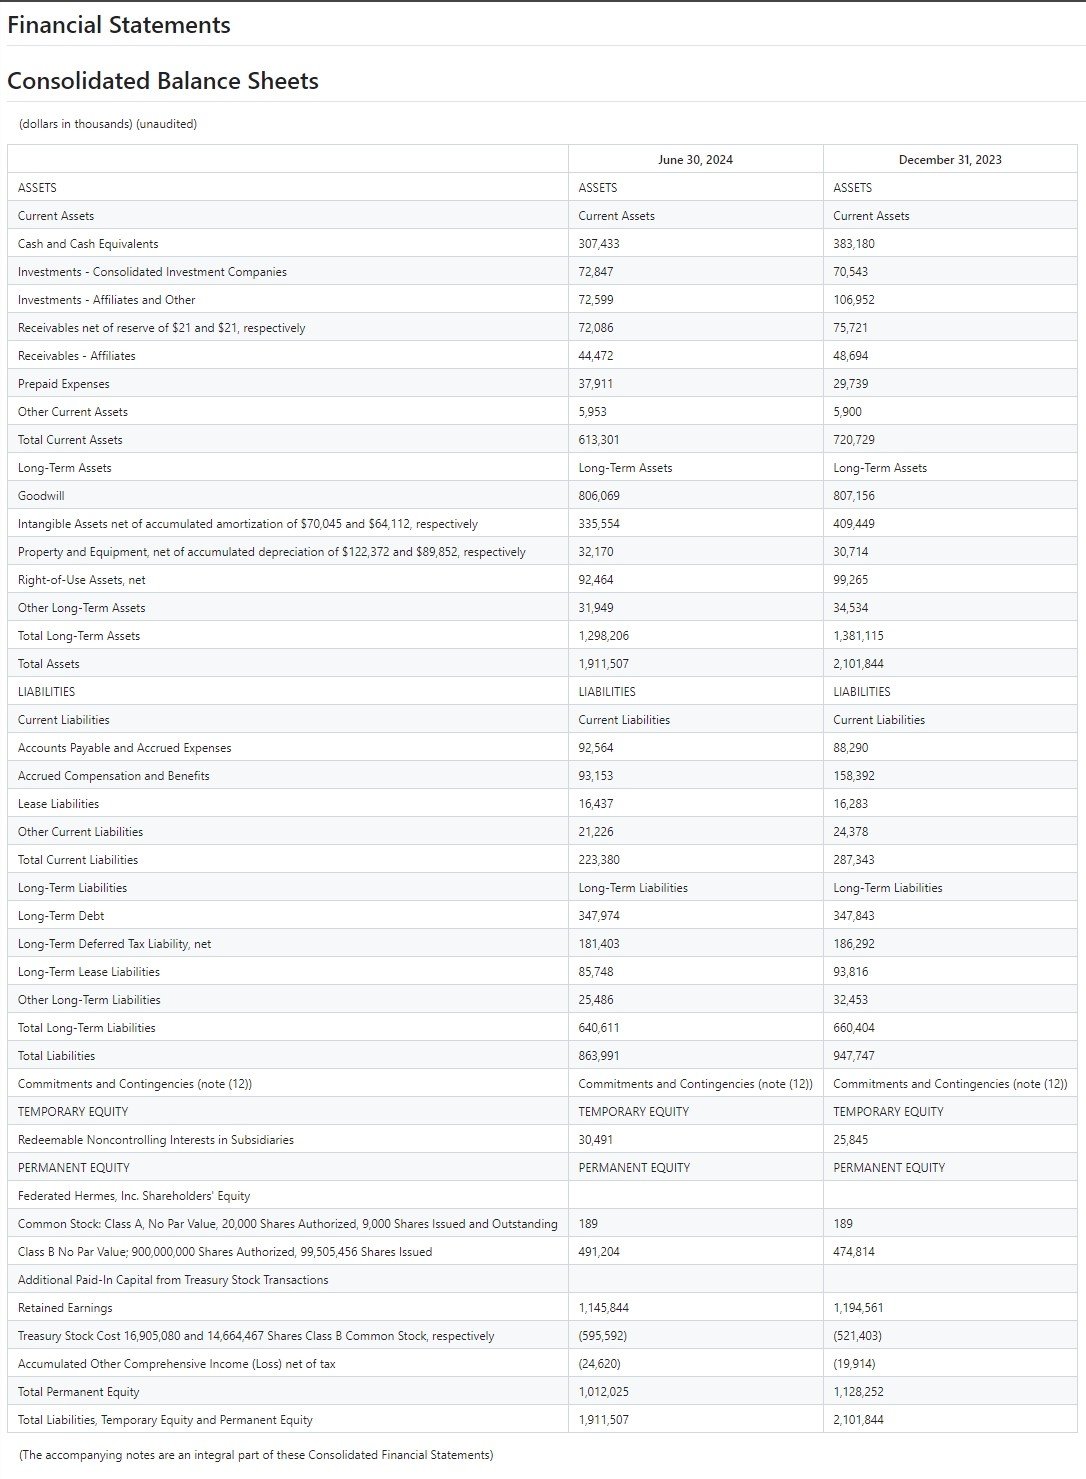
Raw Markdown
# Financial Statements

# Consolidated Balance Sheets

(dollars in thousands) (unaudited)

| |June 30, 2024|December 31, 2023|
|---|---|---|
|ASSETS|ASSETS|ASSETS|
|Current Assets|Current Assets|Current Assets|
|Cash and Cash Equivalents|307,433|383,180|
|Investments - Consolidated Investment Companies|72,847|70,543|
|Investments - Affiliates and Other|72,599|106,952|
|Receivables net of reserve of $21 and $21, respectively|72,086|75,721|
|Receivables - Affiliates|44,472|48,694|
|Prepaid Expenses|37,911|29,739|
|Other Current Assets|5,953|5,900|
|Total Current Assets|613,301|720,729|
|Long-Term Assets|Long-Term Assets|Long-Term Assets|
|Goodwill|806,069|807,156|
|Intangible Assets net of accumulated amortization of $70,045 and $64,112, respectively|335,554|409,449|
|Property and Equipment, net of accumulated depreciation of $122,372 and $89,852, respectively|32,170|30,714|
|Right-of-Use Assets, net|92,464|99,265|
|Other Long-Term Assets|31,949|34,534|
|Total Long-Term Assets|1,298,206|1,381,115|
|Total Assets|1,911,507|2,101,844|
|LIABILITIES|LIABILITIES|LIABILITIES|
|Current Liabilities|Current Liabilities|Current Liabilities|
|Accounts Payable and Accrued Expenses|92,564|88,290|
|Accrued Compensation and Benefits|93,153|158,392|
|Lease Liabilities|16,437|16,283|
|Other Current Liabilities|21,226|24,378|
|Total Current Liabilities|223,380|287,343|
|Long-Term Liabilities|Long-Term Liabilities|Long-Term Liabilities|
|Long-Term Debt|347,974|347,843|
|Long-Term Deferred Tax Liability, net|181,403|186,292|
|Long-Term Lease Liabilities|85,748|93,816|
|Other Long-Term Liabilities|25,486|32,453|
|Total Long-Term Liabilities|640,611|660,404|
|Total Liabilities|863,991|947,747|
|Commitments and Contingencies (note (12))|Commitments and Contingencies (note (12))|Commitments and Contingencies (note (12))|
|TEMPORARY EQUITY|TEMPORARY EQUITY|TEMPORARY EQUITY|
|Redeemable Noncontrolling Interests in Subsidiaries|30,491|25,845|
|PERMANENT EQUITY|PERMANENT EQUITY|PERMANENT EQUITY|
|Federated Hermes, Inc. Shareholders' Equity| | |
|Common Stock: Class A, No Par Value, 20,000 Shares Authorized, 9,000 Shares Issued and Outstanding|189|189|
|Class B No Par Value; 900,000,000 Shares Authorized, 99,505,456 Shares Issued|491,204|474,814|
|Additional Paid-In Capital from Treasury Stock Transactions| | |
|Retained Earnings|1,145,844|1,194,561|
|Treasury Stock Cost 16,905,080 and 14,664,467 Shares Class B Common Stock, respectively|(595,592)|(521,403)|
|Accumulated Other Comprehensive Income (Loss) net of tax|(24,620)|(19,914)|
|Total Permanent Equity|1,012,025|1,128,252|
|Total Liabilities, Temporary Equity and Permanent Equity|1,911,507|2,101,844|

(The accompanying notes are an integral part of these Consolidated Financial Statements)
Premium Mode
Rendered Markdown
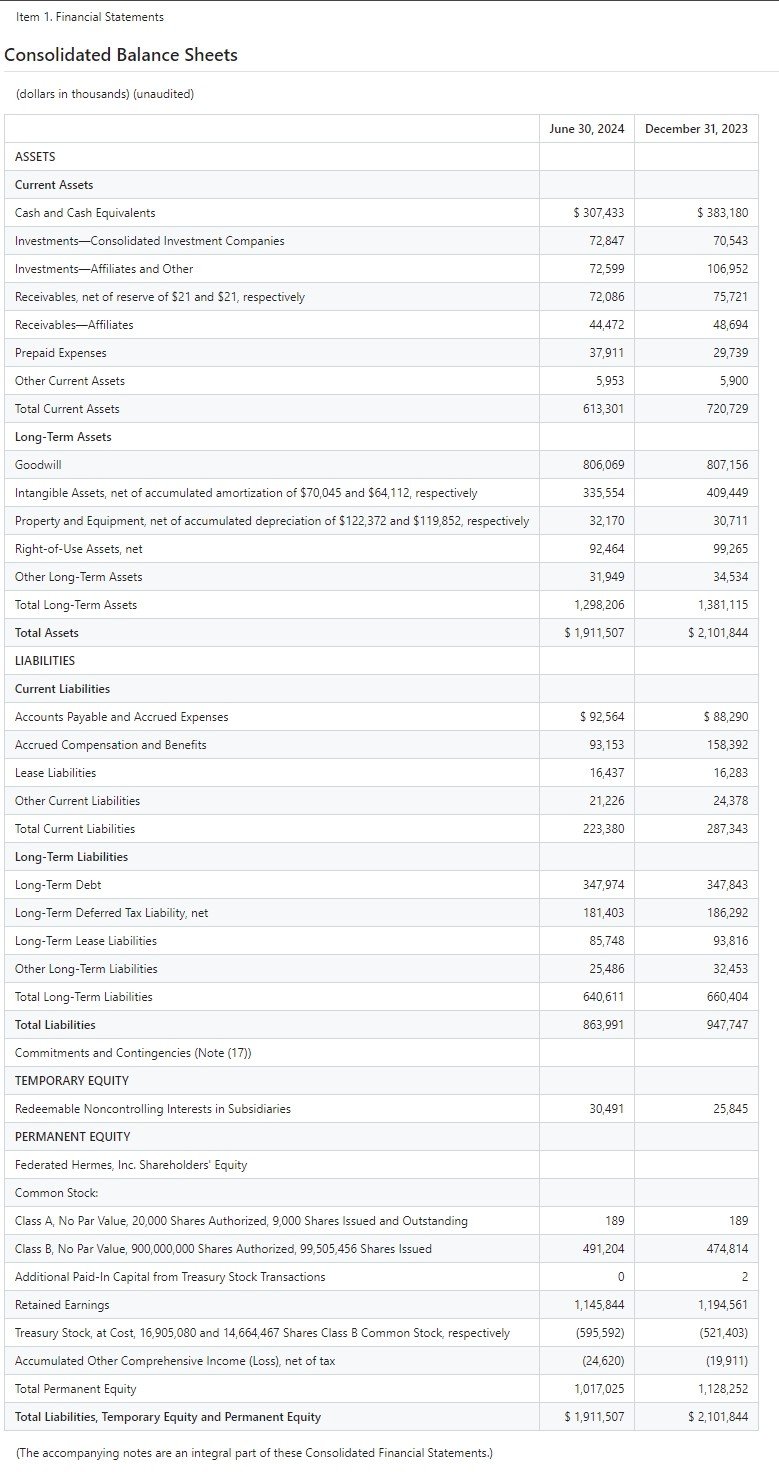
Raw Markdown
Item 1. Financial Statements

## Consolidated Balance Sheets
(dollars in thousands)
(unaudited)

| | June 30, 2024 | December 31, 2023 |
|---|---:|---:|
| **ASSETS** | | |
| **Current Assets** | | |
| Cash and Cash Equivalents | $ 307,433 | $ 383,180 |
| Investments—Consolidated Investment Companies | 72,847 | 70,543 |
| Investments—Affiliates and Other | 72,599 | 106,952 |
| Receivables, net of reserve of $21 and $21, respectively | 72,086 | 75,721 |
| Receivables—Affiliates | 44,472 | 48,694 |
| Prepaid Expenses | 37,911 | 29,739 |
| Other Current Assets | 5,953 | 5,900 |
| Total Current Assets | 613,301 | 720,729 |
| **Long-Term Assets** | | |
| Goodwill | 806,069 | 807,156 |
| Intangible Assets, net of accumulated amortization of $70,045 and $64,112, respectively | 335,554 | 409,449 |
| Property and Equipment, net of accumulated depreciation of $122,372 and $119,852, respectively | 32,170 | 30,711 |
| Right-of-Use Assets, net | 92,464 | 99,265 |
| Other Long-Term Assets | 31,949 | 34,534 |
| Total Long-Term Assets | 1,298,206 | 1,381,115 |
| **Total Assets** | $ 1,911,507 | $ 2,101,844 |
| **LIABILITIES** | | |
| **Current Liabilities** | | |
| Accounts Payable and Accrued Expenses | $ 92,564 | $ 88,290 |
| Accrued Compensation and Benefits | 93,153 | 158,392 |
| Lease Liabilities | 16,437 | 16,283 |
| Other Current Liabilities | 21,226 | 24,378 |
| Total Current Liabilities | 223,380 | 287,343 |
| **Long-Term Liabilities** | | |
| Long-Term Debt | 347,974 | 347,843 |
| Long-Term Deferred Tax Liability, net | 181,403 | 186,292 |
| Long-Term Lease Liabilities | 85,748 | 93,816 |
| Other Long-Term Liabilities | 25,486 | 32,453 |
| Total Long-Term Liabilities | 640,611 | 660,404 |
| **Total Liabilities** | 863,991 | 947,747 |
| Commitments and Contingencies (Note (17)) | | |
| **TEMPORARY EQUITY** | | |
| Redeemable Noncontrolling Interests in Subsidiaries | 30,491 | 25,845 |
| **PERMANENT EQUITY** | | |
| Federated Hermes, Inc. Shareholders' Equity | | |
| Common Stock: | | |
| Class A, No Par Value, 20,000 Shares Authorized, 9,000 Shares Issued and Outstanding | 189 | 189 |
| Class B, No Par Value, 900,000,000 Shares Authorized, 99,505,456 Shares Issued | 491,204 | 474,814 |
| Additional Paid-In Capital from Treasury Stock Transactions | 0 | 2 |
| Retained Earnings | 1,145,844 | 1,194,561 |
| Treasury Stock, at Cost, 16,905,080 and 14,664,467 Shares Class B Common Stock, respectively | (595,592) | (521,403) |
| Accumulated Other Comprehensive Income (Loss), net of tax | (24,620) | (19,911) |
| Total Permanent Equity | 1,017,025 | 1,128,252 |
| **Total Liabilities, Temporary Equity and Permanent Equity** | $ 1,911,507 | $ 2,101,844 |

(The accompanying notes are an integral part of these Consolidated Financial Statements.)
Unstructured.IO
Hires Mode
Rendered Markdown
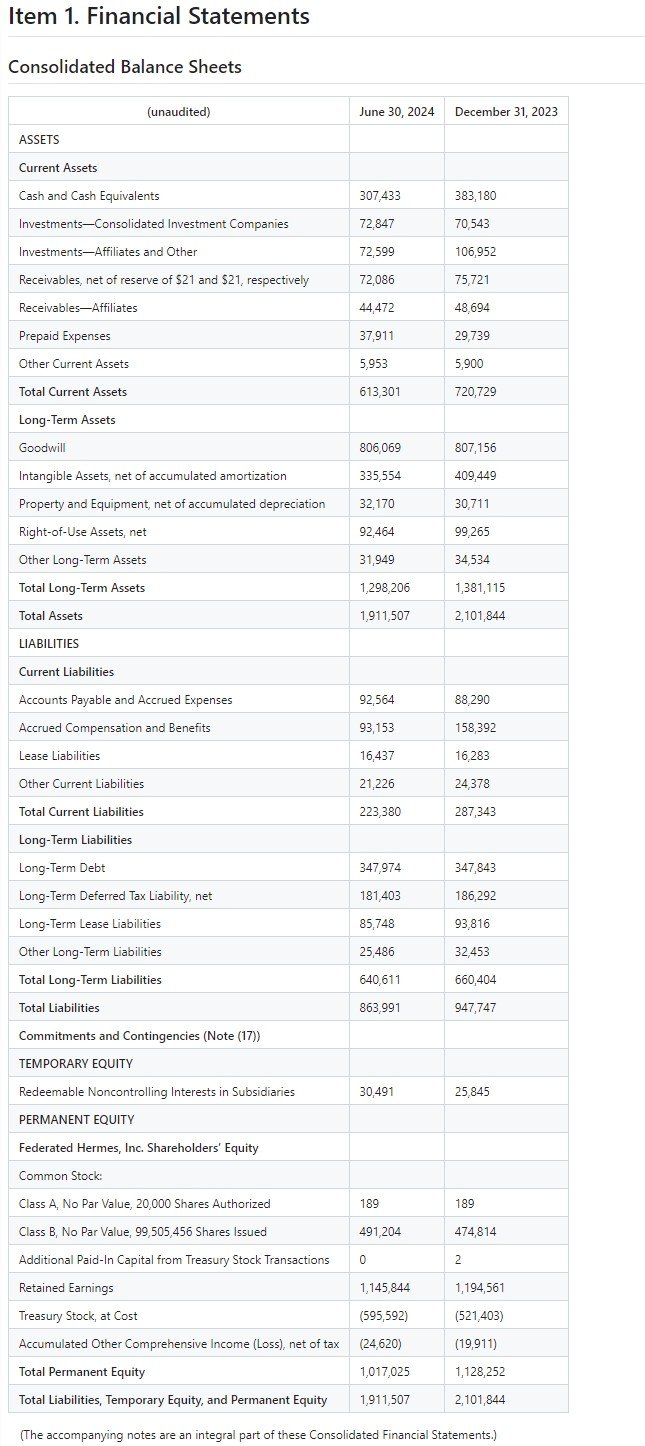
Raw Markdown
(Converted from HTML to Markdown using ChatGPT)
# Item 1. Financial Statements
## Consolidated Balance Sheets

| (unaudited)                                                | June 30, 2024 | December 31, 2023 |
|------------------------------------------------------------|---------------|-------------------|
| **ASSETS**                                                 |               |                   |
| **Current Assets**                                         |               |                   |
| Cash and Cash Equivalents                                  | 307,433       | 383,180           |
| Investments—Consolidated Investment Companies              | 72,847        | 70,543            |
| Investments—Affiliates and Other                           | 72,599        | 106,952           |
| Receivables, net of reserve of $21 and $21, respectively   | 72,086        | 75,721            |
| Receivables—Affiliates                                     | 44,472        | 48,694            |
| Prepaid Expenses                                           | 37,911        | 29,739            |
| Other Current Assets                                       | 5,953         | 5,900             |
| **Total Current Assets**                                   | 613,301       | 720,729           |
| **Long-Term Assets**                                       |               |                   |
| Goodwill                                                   | 806,069       | 807,156           |
| Intangible Assets, net of accumulated amortization         | 335,554       | 409,449           |
| Property and Equipment, net of accumulated depreciation    | 32,170        | 30,711            |
| Right-of-Use Assets, net                                   | 92,464        | 99,265            |
| Other Long-Term Assets                                     | 31,949        | 34,534            |
| **Total Long-Term Assets**                                 | 1,298,206     | 1,381,115         |
| **Total Assets**                                           | 1,911,507     | 2,101,844         |
| **LIABILITIES**                                            |               |                   |
| **Current Liabilities**                                    |               |                   |
| Accounts Payable and Accrued Expenses                      | 92,564        | 88,290            |
| Accrued Compensation and Benefits                          | 93,153        | 158,392           |
| Lease Liabilities                                          | 16,437        | 16,283            |
| Other Current Liabilities                                  | 21,226        | 24,378            |
| **Total Current Liabilities**                              | 223,380       | 287,343           |
| **Long-Term Liabilities**                                  |               |                   |
| Long-Term Debt                                             | 347,974       | 347,843           |
| Long-Term Deferred Tax Liability, net                      | 181,403       | 186,292           |
| Long-Term Lease Liabilities                                | 85,748        | 93,816            |
| Other Long-Term Liabilities                                | 25,486        | 32,453            |
| **Total Long-Term Liabilities**                            | 640,611       | 660,404           |
| **Total Liabilities**                                      | 863,991       | 947,747           |
| **Commitments and Contingencies (Note (17))**              |               |                   |
| **TEMPORARY EQUITY**                                       |               |                   |
| Redeemable Noncontrolling Interests in Subsidiaries        | 30,491        | 25,845            |
| **PERMANENT EQUITY**                                       |               |                   |
| **Federated Hermes, Inc. Shareholders’ Equity**            |               |                   |
| Common Stock:                                              |               |                   |
| Class A, No Par Value, 20,000 Shares Authorized            | 189           | 189               |
| Class B, No Par Value, 99,505,456 Shares Issued            | 491,204       | 474,814           |
| Additional Paid-In Capital from Treasury Stock Transactions | 0            | 2                 |
| Retained Earnings                                          | 1,145,844     | 1,194,561         |
| Treasury Stock, at Cost                                    | (595,592)     | (521,403)         |
| Accumulated Other Comprehensive Income (Loss), net of tax  | (24,620)      | (19,911)          |
| **Total Permanent Equity**                                 | 1,017,025     | 1,128,252         |
| **Total Liabilities, Temporary Equity, and Permanent Equity** | 1,911,507 | 2,101,844         |

(The accompanying notes are an integral part of these Consolidated Financial Statements.)
Reducto
Rendered Markdown
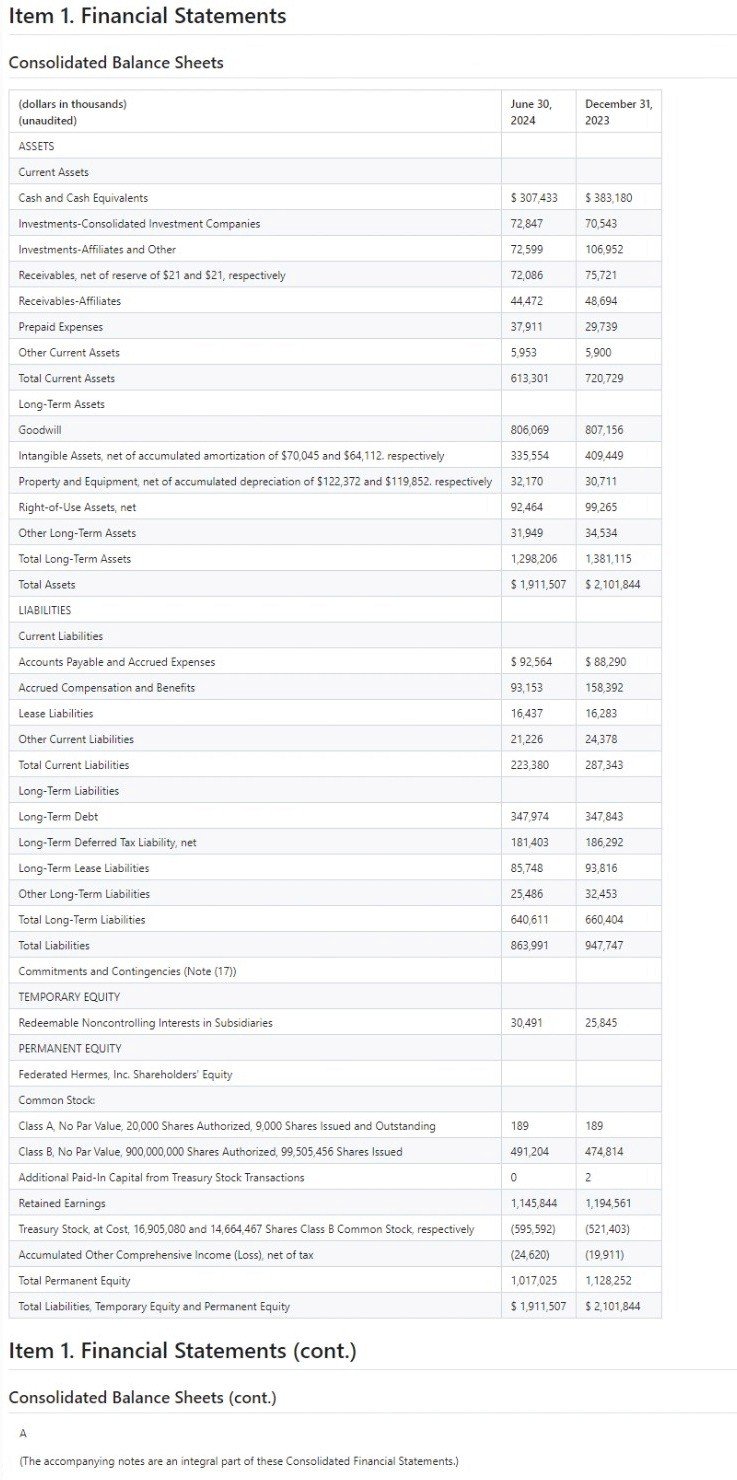
Raw Markdown
# Item 1. Financial Statements

## Consolidated Balance Sheets

| (dollars in thousands)<br>(unaudited) | June 30,<br>2024 | December 31,<br>2023 |
| :--- | :--- | :--- |
| ASSETS |  |  |
| Current Assets |  |  |
| Cash and Cash Equivalents | $ 307,433 | $ 383,180 |
| Investments-Consolidated Investment Companies | 72,847 | 70,543 |
| Investments-Affiliates and Other | 72,599 | 106,952 |
| Receivables, net of reserve of $21 and $21, respectively | 72,086 | 75,721 |
| Receivables-Affiliates | 44,472 | 48,694 |
| Prepaid Expenses | 37,911 | 29,739 |
| Other Current Assets | 5,953 | 5,900 |
| Total Current Assets | 613,301 | 720,729 |
| Long-Term Assets |
| Goodwill | 806,069 | 807,156 |
| Intangible Assets, net of accumulated amortization of $70,045 and $64,112. respectively | 335,554 | 409,449 |
| Property and Equipment, net of accumulated depreciation of $122,372 and $119,852. respectively | 32,170 | 30,711 |
| Right-of-Use Assets, net | 92,464 | 99,265 |
| Other Long-Term Assets | 31,949 | 34,534 |
| Total Long-Term Assets | 1,298,206 | 1,381,115 |
| Total Assets | $ 1,911,507 | $ 2,101,844 |
| LIABILITIES |  |  |
| Current Liabilities |  |  |
| Accounts Payable and Accrued Expenses | $ 92,564 | $ 88,290 |
| Accrued Compensation and Benefits | 93,153 | 158,392 |
| Lease Liabilities | 16,437 | 16,283 |
| Other Current Liabilities | 21,226 | 24,378 |
| Total Current Liabilities | 223,380 | 287,343 |
| Long-Term Liabilities |
| Long-Term Debt | 347,974 | 347,843 |
| Long-Term Deferred Tax Liability, net | 181,403 | 186,292 |
| Long-Term Lease Liabilities | 85,748 | 93,816 |
| Other Long-Term Liabilities | 25,486 | 32,453 |
| Total Long-Term Liabilities | 640,611 | 660,404 |
| Total Liabilities | 863,991 | 947,747 |
| Commitments and Contingencies (Note (17)) |
| TEMPORARY EQUITY |
| Redeemable Noncontrolling Interests in Subsidiaries | 30,491 | 25,845 |
| PERMANENT EQUITY |
| Federated Hermes, Inc. Shareholders' Equity |
| Common Stock: |  |  |
| Class A, No Par Value, 20,000 Shares Authorized, 9,000 Shares Issued and Outstanding | 189 | 189 |
| Class B, No Par Value, 900,000,000 Shares Authorized, 99,505,456 Shares Issued | 491,204 | 474,814 |
| Additional Paid-In Capital from Treasury Stock Transactions | 0 | 2 |
| Retained Earnings | 1,145,844 | 1,194,561 |
| Treasury Stock, at Cost, 16,905,080 and 14,664,467 Shares Class B Common Stock, respectively | (595,592) | (521,403) |
| Accumulated Other Comprehensive Income (Loss), net of tax | (24,620) | (19,911) |
| Total Permanent Equity | 1,017,025 | 1,128,252 |
| Total Liabilities, Temporary Equity and Permanent Equity | $ 1,911,507 | $ 2,101,844 |

# Item 1. Financial Statements (cont.)

## Consolidated Balance Sheets (cont.)

A

(The accompanying notes are an integral part of these Consolidated Financial Statements.)
Zerox (from OmniAI)
Rendered Markdown
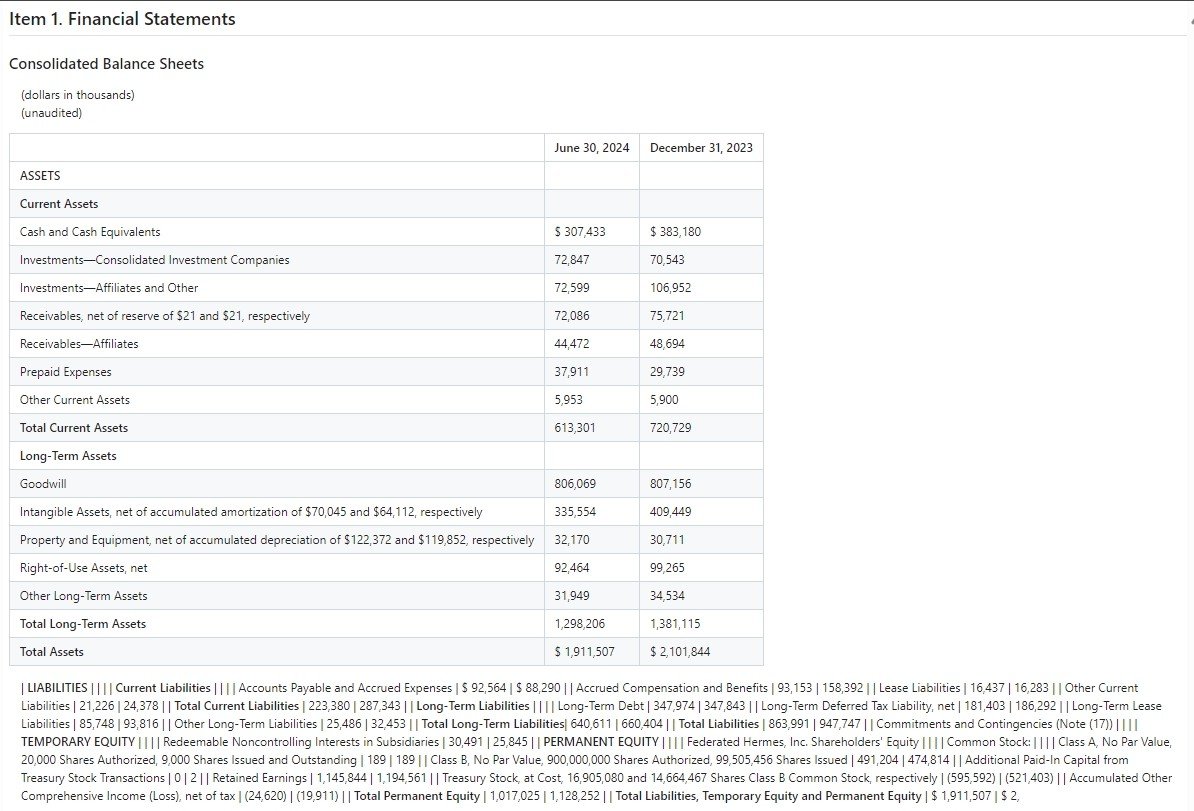
Raw Markdown
## Item 1. Financial Statements

### Consolidated Balance Sheets
(dollars in thousands)
(unaudited)

|                                | June 30, 2024 | December 31, 2023 |
|--------------------------------|---------------|-------------------|
| **ASSETS**                     |               |                   |
| **Current Assets**             |               |                   |
| Cash and Cash Equivalents      | $ 307,433     | $ 383,180         |
| Investments—Consolidated Investment Companies | 72,847 | 70,543   |
| Investments—Affiliates and Other | 72,599      | 106,952           |
| Receivables, net of reserve of $21 and $21, respectively | 72,086 | 75,721 |
| Receivables—Affiliates         | 44,472        | 48,694            |
| Prepaid Expenses               | 37,911        | 29,739            |
| Other Current Assets           | 5,953         | 5,900             |
| **Total Current Assets**       | 613,301       | 720,729           |
| **Long-Term Assets**           |               |                   |
| Goodwill                       | 806,069       | 807,156           |
| Intangible Assets, net of accumulated amortization of $70,045 and $64,112, respectively | 335,554 | 409,449 |
| Property and Equipment, net of accumulated depreciation of $122,372 and $119,852, respectively | 32,170 | 30,711 |
| Right-of-Use Assets, net       | 92,464        | 99,265            |
| Other Long-Term Assets         | 31,949        | 34,534            |
| **Total Long-Term Assets**     | 1,298,206     | 1,381,115         |
| **Total Assets**               | $ 1,911,507   | $ 2,101,844       |

| **LIABILITIES**                |               |                   |
| **Current Liabilities**        |               |                   |
| Accounts Payable and Accrued Expenses | $ 92,564 | $ 88,290        |
| Accrued Compensation and Benefits | 93,153     | 158,392          |
| Lease Liabilities              | 16,437        | 16,283            |
| Other Current Liabilities      | 21,226        | 24,378            |
| **Total Current Liabilities**  | 223,380       | 287,343           |
| **Long-Term Liabilities**      |               |                   |
| Long-Term Debt                 | 347,974       | 347,843           |
| Long-Term Deferred Tax Liability, net | 181,403 | 186,292          |
| Long-Term Lease Liabilities    | 85,748        | 93,816            |
| Other Long-Term Liabilities    | 25,486        | 32,453            |
| **Total Long-Term Liabilities**| 640,611       | 660,404           |
| **Total Liabilities**          | 863,991       | 947,747           |
| Commitments and Contingencies (Note (17)) |     |                   |
| **TEMPORARY EQUITY**           |               |                   |
| Redeemable Noncontrolling Interests in Subsidiaries | 30,491 | 25,845 |
| **PERMANENT EQUITY**           |               |                   |
| Federated Hermes, Inc. Shareholders' Equity |   |                   |
| Common Stock:                  |               |                   |
| Class A, No Par Value, 20,000 Shares Authorized, 9,000 Shares Issued and Outstanding | 189 | 189 |
| Class B, No Par Value, 900,000,000 Shares Authorized, 99,505,456 Shares Issued | 491,204 | 474,814 |
| Additional Paid-In Capital from Treasury Stock Transactions | 0 | 2 |
| Retained Earnings              | 1,145,844     | 1,194,561         |
| Treasury Stock, at Cost, 16,905,080 and 14,664,467 Shares Class B Common Stock, respectively | (595,592) | (521,403) |
| Accumulated Other Comprehensive Income (Loss), net of tax | (24,620) | (19,911) |
| **Total Permanent Equity**     | 1,017,025     | 1,128,252         |
| **Total Liabilities, Temporary Equity and Permanent Equity** | $ 1,911,507 | $ 2,
Chunkr
Rendered Markdown
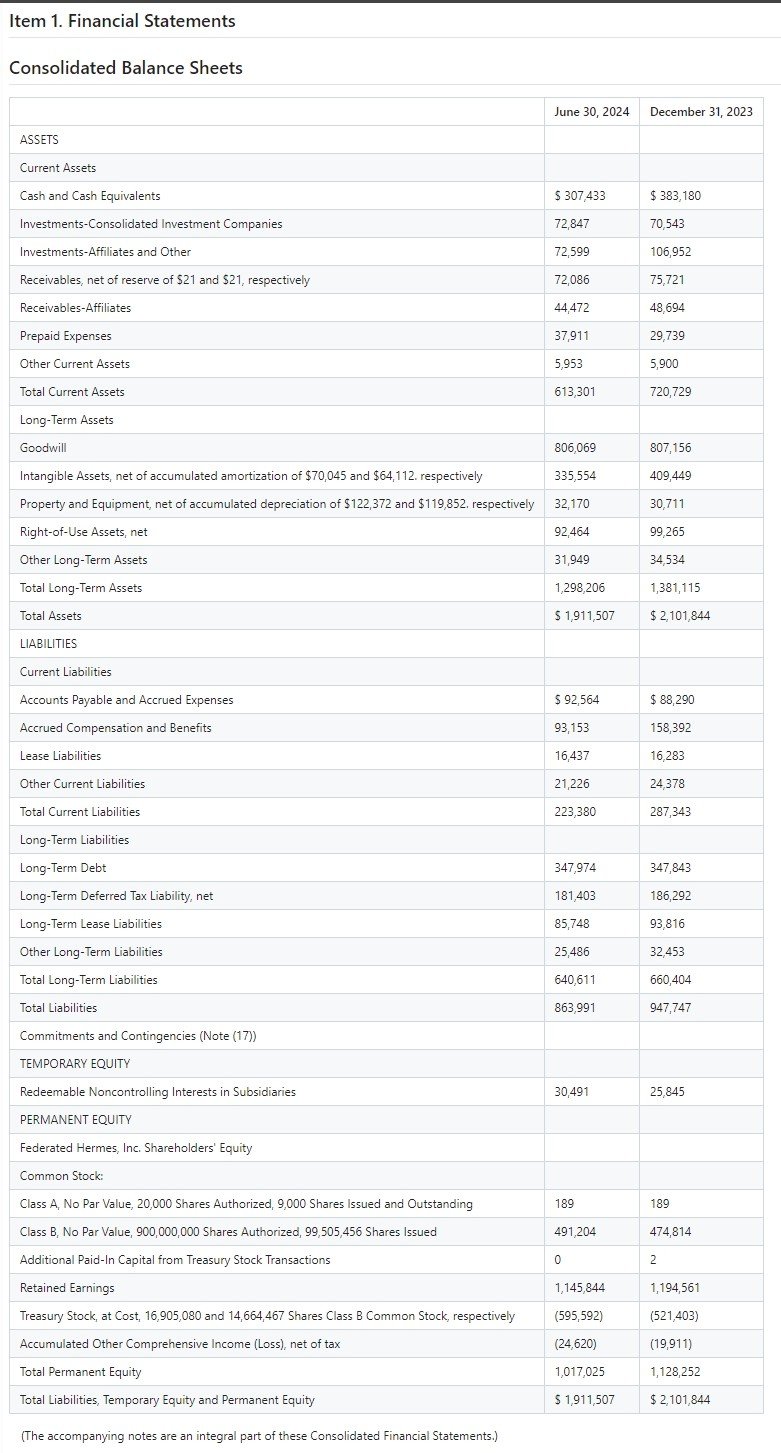
Raw Markdown
## Item 1. Financial Statements

## Consolidated Balance Sheets

|  | June 30, 2024 | December 31, 2023 |
| --- | --- | --- |
| ASSETS | | |
| Current Assets | | |
| Cash and Cash Equivalents | $ 307,433 | $ 383,180 |
| Investments-Consolidated Investment Companies | 72,847 | 70,543 |
| Investments-Affiliates and Other | 72,599 | 106,952 |
| Receivables, net of reserve of $21 and $21, respectively | 72,086 | 75,721 |
| Receivables-Affiliates | 44,472 | 48,694 |
| Prepaid Expenses | 37,911 | 29,739 |
| Other Current Assets | 5,953 | 5,900 |
| Total Current Assets | 613,301 | 720,729 |
| Long-Term Assets | | |
| Goodwill | 806,069 | 807,156 |
| Intangible Assets, net of accumulated amortization of $70,045 and $64,112. respectively | 335,554 | 409,449 |
| Property and Equipment, net of accumulated depreciation of $122,372 and $119,852. respectively | 32,170 | 30,711 |
| Right-of-Use Assets, net | 92,464 | 99,265 |
| Other Long-Term Assets | 31,949 | 34,534 |
| Total Long-Term Assets | 1,298,206 | 1,381,115 |
| Total Assets | $ 1,911,507 | $ 2,101,844 |
| LIABILITIES | | |
| Current Liabilities | | |
| Accounts Payable and Accrued Expenses | $ 92,564 | $ 88,290 |
| Accrued Compensation and Benefits | 93,153 | 158,392 |
| Lease Liabilities | 16,437 | 16,283 |
| Other Current Liabilities | 21,226 | 24,378 |
| Total Current Liabilities | 223,380 | 287,343 |
| Long-Term Liabilities | | |
| Long-Term Debt | 347,974 | 347,843 |
| Long-Term Deferred Tax Liability, net | 181,403 | 186,292 |
| Long-Term Lease Liabilities | 85,748 | 93,816 |
| Other Long-Term Liabilities | 25,486 | 32,453 |
| Total Long-Term Liabilities | 640,611 | 660,404 |
| Total Liabilities | 863,991 | 947,747 |
| Commitments and Contingencies (Note (17)) | | |
| TEMPORARY EQUITY | | |
| Redeemable Noncontrolling Interests in Subsidiaries | 30,491 | 25,845 |
| PERMANENT EQUITY | | |
| Federated Hermes, Inc. Shareholders' Equity | | |
| Common Stock: | | |
| Class A, No Par Value, 20,000 Shares Authorized, 9,000 Shares Issued and Outstanding | 189 | 189 |
| Class B, No Par Value, 900,000,000 Shares Authorized, 99,505,456 Shares Issued | 491,204 | 474,814 |
| Additional Paid-In Capital from Treasury Stock Transactions | 0 | 2 |
| Retained Earnings | 1,145,844 | 1,194,561 |
| Treasury Stock, at Cost, 16,905,080 and 14,664,467 Shares Class B Common Stock, respectively | (595,592) | (521,403) |
| Accumulated Other Comprehensive Income (Loss), net of tax | (24,620) | (19,911) |
| Total Permanent Equity | 1,017,025 | 1,128,252 |
| Total Liabilities, Temporary Equity and Permanent Equity | $ 1,911,507 | $ 2,101,844 |

(The accompanying notes are an integral part of these Consolidated Financial Statements.)
Graphlit
Default Mode (using Azure AI Document Intelligence)
We used the 'Layout' model from Azure AI for this document extraction.
Rendered Markdown

Raw Markdown
### Item 1. Financial Statements

### Consolidated Balance Sheets (dollars in thousands)

| (unaudited) June 30, December 31, 2024 2023
| --- |
| ASSETS |  |  |
| Current Assets |  |  |
| Cash and Cash Equivalents | $ 307,433 | $ 383,180 |
| Investments-Consolidated Investment Companies | 72,847 | 70,543 |
| Investments-Affiliates and Other | 72,599 | 106,952 |
| Receivables, net of reserve of $21 and $21, respectively | 72,086 | 75,721 |
| Receivables-Affiliates | 44,472 | 48,694 |
| Prepaid Expenses | 37,911 | 29,739 |
| Other Current Assets | 5,953 | 5,900 |
| Total Current Assets | 613,301 | 720,729 |
| Long-Term Assets |  |  |
| Goodwill | 806,069 | 807,156 |
| Intangible Assets, net of accumulated amortization of $70,045 and $64,112, respectively | 335,554 | 409,449 |
| Property and Equipment, net of accumulated depreciation of $122,372 and $119,852, respectively | 32,170 | 30,711 |
| Right-of-Use Assets, net | 92,464 | 99,265 |
| Other Long-Term Assets | 31,949 | 34,534 |
| Total Long-Term Assets | 1,298,206 | 1,381,115 |
| Total Assets | $ 1,911,507 | $ 2,101,844 |
| LIABILITIES |  |  |
| Current Liabilities |  |  |
| Accounts Payable and Accrued Expenses | $ 92,564 | $ 88,290 |
| Accrued Compensation and Benefits | 93,153 | 158,392 |
| Lease Liabilities | 16,437 | 16,283 |
| Other Current Liabilities | 21,226 | 24,378 |
| Total Current Liabilities | 223,380 | 287,343 |
| Long-Term Liabilities |  |  |
| Long-Term Debt | 347,974 | 347,843 |
| Long-Term Deferred Tax Liability, net | 181,403 | 186,292 |
| Long-Term Lease Liabilities | 85,748 | 93,816 |
| Other Long-Term Liabilities | 25,486 | 32,453 |
| Total Long-Term Liabilities | 640,611 | 660,404 |
| Total Liabilities | 863,991 | 947,747 |
| Commitments and Contingencies (Note (17)) |  |  |
| TEMPORARY EQUITY |  |  |
| Redeemable Noncontrolling Interests in Subsidiaries | 30,491 | 25,845 |
| PERMANENT EQUITY |  |  |
| Federated Hermes, Inc. Shareholders' Equity |  |  |
| Common Stock: |  |  |
| Class A, No Par Value, 20,000 Shares Authorized, 9,000 Shares Issued and Outstanding | 189 | 189 |
| Class B, No Par Value, 900,000,000 Shares Authorized, 99,505,456 Shares Issued | 491,204 | 474,814 |
| Additional Paid-In Capital from Treasury Stock Transactions | 0 | 2 |
| Retained Earnings | 1,145,844 | 1,194,561 |
| Treasury Stock, at Cost, 16,905,080 and 14,664,467 Shares Class B Common Stock, respectively | (595,592) | (521,403) |
| Accumulated Other Comprehensive Income (Loss), net of tax | (24,620) | (19,911) |
| Total Permanent Equity | 1,017,025 | 1,128,252 |
| Total Liabilities, Temporary Equity and Permanent Equity | $ 1,911,507 | $ 2,101,844 |

(The accompanying notes are an integral part of these Consolidated Financial Statements.)
LLM Mode (using Anthropic Sonnet 3.5)
Rendered Markdown
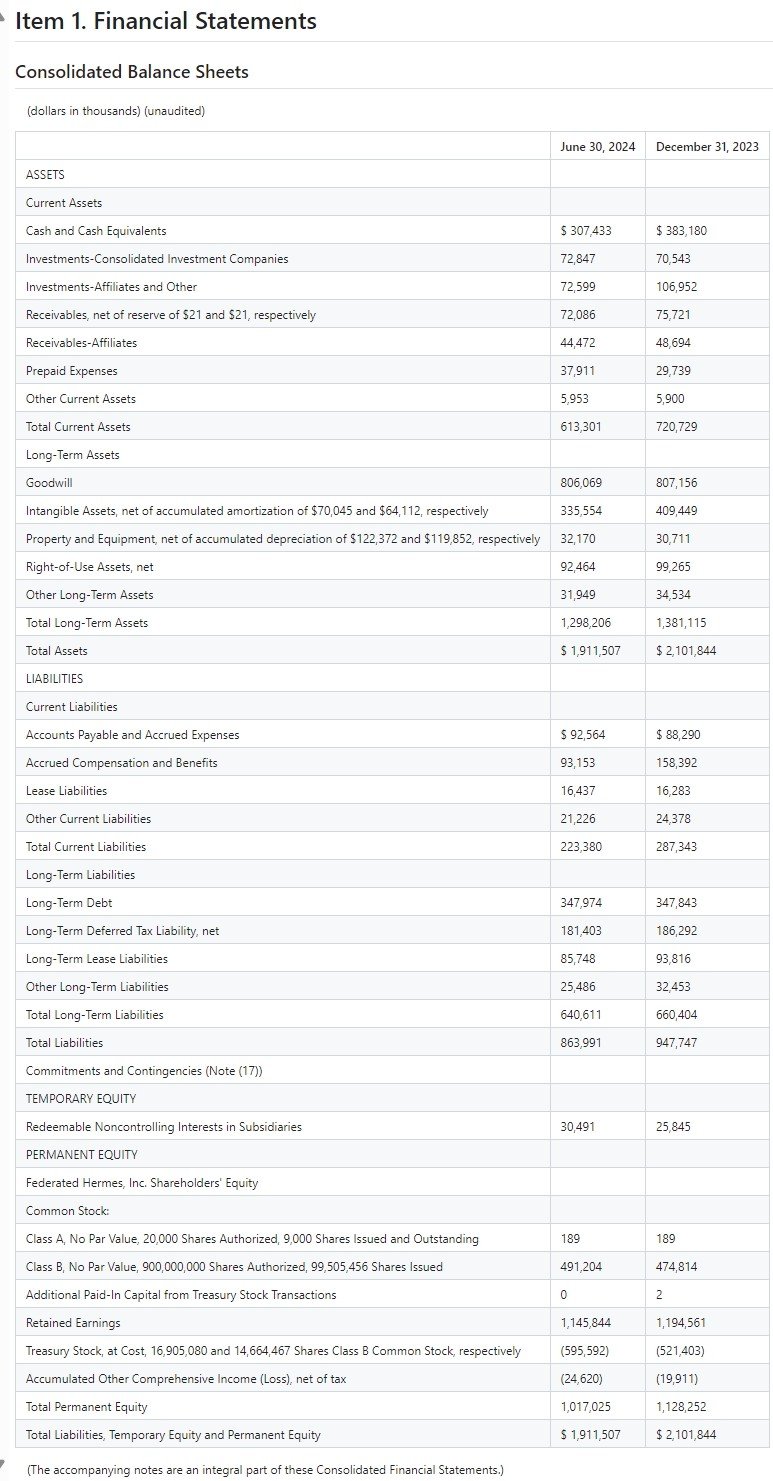
Raw Markdown
# Item 1. Financial Statements

## Consolidated Balance Sheets

(dollars in thousands)
(unaudited)

|  | June 30, 2024 | December 31, 2023
| --- | --- | --- |
| ASSETS |  |  |
| Current Assets |  |  |
| Cash and Cash Equivalents | $ 307,433 | $ 383,180 |
| Investments-Consolidated Investment Companies | 72,847 | 70,543 |
| Investments-Affiliates and Other | 72,599 | 106,952 |
| Receivables, net of reserve of $21 and $21, respectively | 72,086 | 75,721 |
| Receivables-Affiliates | 44,472 | 48,694 |
| Prepaid Expenses | 37,911 | 29,739 |
| Other Current Assets | 5,953 | 5,900 |
| Total Current Assets | 613,301 | 720,729 |
| Long-Term Assets |  |  |
| Goodwill | 806,069 | 807,156 |
| Intangible Assets, net of accumulated amortization of $70,045 and $64,112, respectively | 335,554 | 409,449 |
| Property and Equipment, net of accumulated depreciation of $122,372 and $119,852, respectively | 32,170 | 30,711 |
| Right-of-Use Assets, net | 92,464 | 99,265 |
| Other Long-Term Assets | 31,949 | 34,534 |
| Total Long-Term Assets | 1,298,206 | 1,381,115 |
| Total Assets | $ 1,911,507 | $ 2,101,844 |
| LIABILITIES |  |  |
| Current Liabilities |  |  |
| Accounts Payable and Accrued Expenses | $ 92,564 | $ 88,290 |
| Accrued Compensation and Benefits | 93,153 | 158,392 |
| Lease Liabilities | 16,437 | 16,283 |
| Other Current Liabilities | 21,226 | 24,378 |
| Total Current Liabilities | 223,380 | 287,343 |
| Long-Term Liabilities |  |  |
| Long-Term Debt | 347,974 | 347,843 |
| Long-Term Deferred Tax Liability, net | 181,403 | 186,292 |
| Long-Term Lease Liabilities | 85,748 | 93,816 |
| Other Long-Term Liabilities | 25,486 | 32,453 |
| Total Long-Term Liabilities | 640,611 | 660,404 |
| Total Liabilities | 863,991 | 947,747 |
| Commitments and Contingencies (Note (17)) |  |  |
| TEMPORARY EQUITY |  |  |
| Redeemable Noncontrolling Interests in Subsidiaries | 30,491 | 25,845 |
| PERMANENT EQUITY |  |  |
| Federated Hermes, Inc. Shareholders' Equity |  |  |
| Common Stock: |  |  |
| Class A, No Par Value, 20,000 Shares Authorized, 9,000 Shares Issued and Outstanding | 189 | 189 |
| Class B, No Par Value, 900,000,000 Shares Authorized, 99,505,456 Shares Issued | 491,204 | 474,814 |
| Additional Paid-In Capital from Treasury Stock Transactions | 0 | 2 |
| Retained Earnings | 1,145,844 | 1,194,561 |
| Treasury Stock, at Cost, 16,905,080 and 14,664,467 Shares Class B Common Stock, respectively | (595,592) | (521,403) |
| Accumulated Other Comprehensive Income (Loss), net of tax | (24,620) | (19,911) |
| Total Permanent Equity | 1,017,025 | 1,128,252 |
| Total Liabilities, Temporary Equity and Permanent Equity | $ 1,911,507 | $ 2,101,844 |

(The accompanying notes are an integral part of these Consolidated Financial Statements.)

4
Results
As you can see, Graphlit using Anthropic Sonnet 3.5 provides the most accurate representation of the original table.
Using the vision model support from Sonnet is able to pick up on small details like the clipped '4' page number at the bottom of the image.

Llamaparse Premium does a nice job, but you can see that it misses extracting the first line as a heading.
Item 1. Financial Statements
Some of the approaches fail to reliably separate the text from the table, as with the Unstructured.IO hi-res model.

There are performance and cost differences with each of these approaches, but when looking for the most accurate extraction of Markdown from complex documents with tables, charts, or other formatting, Graphlit with LLM Mode will provide the best results.
Summary
Please email any questions on this article or the Graphlit Platform to questions@graphlit.com.
For more information, you can read our Graphlit Documentation, visit our marketing site, or join our Discord community.
